
Saturday, July 16, 2011
Another signature of hydrogen bonding
Previously I posted about how significant redshifts in the frequency of the O-H bond stretch can be a signature of hydrogen bonding. Furthermore, there is a fairly universal relationship between the frequency shift and the bond length and energy.
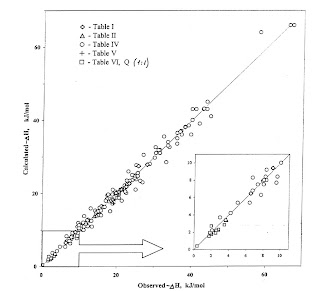 The graph above shows there is also a fairly universal relationship between the bond energy (horizontal scale) and the change in intensity of the O-H infrared absorption intensity, covering a factor of 200 fold variation in the energy. The details are summarised in this paper. The vertical scale is the bond energy calculated from the empirical relation −ΔH=12.2 ΔA1/2 where ΔH is the enthalpy in kJ/mol and ΔA is the change in intensity of the absorption line in units of 10−4 cm mmol−1.

Subscribe to:
Post Comments (Atom)
For my blog Google Analytics has gone weird
I occasionally look at Google Analytics for my blog in the slim hope it might tell me something about the level and nature of interest (or l...

-
 This week Nobel Prizes will be announced. I have not done predictions since 2020 . This is a fun exercise. It is also good to reflect on w...
 -
 The Ising model is a paradigm in both statistical mechanics and condensed matter physics. Today for most theorists it is so familiar that so...
 -
Some of my colleagues and I have started an interesting discussion about how to teach quantum theory to undergraduates. We have courses in t...
No comments:
Post a Comment