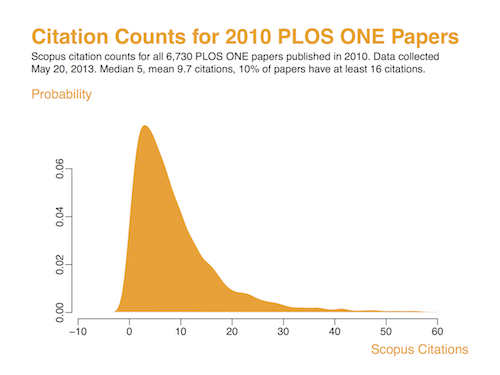
With the usual flurry of Impact Factor announcements due to start any day now, it’s a good time to remember that it is the papers, not the journals they´re published in, that make the impact.It also shows the graph below of the citation distribution for the journal. Note how incredibly broad and asymmetrical the distribution is. I found this interesting because several years ago I wondered what the error bar was on Impact factors, which are often reported to several decimal places.
The editorial points out that the distribution is probably broader for PLOS ONE because it publishes articles from a diversity of fields. Hence, I would still like to see distributions from other journals.


Nature Materials published their citation distribution a couple years ago. It was Poisson distributed, so I downloaded the data and fit it to a decaying exponential, which gave me a mean of 34 and an error of 2. I think impact factors should be thus reported to the nearest integer with the error reported as well.
ReplyDeleteThanks for the very helpful comment. I found the relevant editorial including the distribution curve
Deletehttp://www.nature.com/nmat/journal/v10/n9/full/nmat3114.html
Here is an extract:
"in the skewed distribution of a journal's received citations, which are known to approximately follow a Pareto probability distribution — also known in bibliometrics as Bradford's law3. The Pareto distribution is a power-law function characterized by a long tail — in this context a long tail of highly cited papers "
I recommend it to readers.