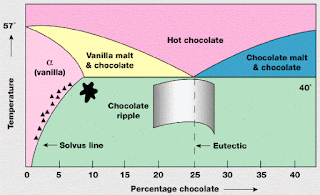
However, in terms of understanding, I always found it a bit bamboozling.
On monday I am giving a lecture on phase transformations of mixtures, closely following the nice textbook by Schroeder, Section 5.4.
Such a phase diagram is quite common.
Below is the phase diagram for the liquid-solid transition in mixtures of tin and lead.
Having prepared the lecture, I now understand the physical origin of these diagrams.
What is amazing is that one can understand these diagrams from simple arguments based on a very simple and physically motivated functional form for the Gibbs free energy that includes the entropy of mixing.
It is of the formG(x) = C + D x + E x(1-x) + T [xlnx + (1-x)ln(1-x)]
where x is the mole fraction of the one substance in the mixture and T is the temperature.
The parameters C, D, and E are constants for a particular state.
The second term represents the free energy difference between pure A and pure B.
The third term represents the energy difference between A-B interactions and the average of A-A and B-B interactions. [I am not sure this is completely necessary].
The crucial last term represents the entropy of mixing (for ideal solutions).
Below one compares the G(x) curves for the three states: alpha (solid mixture with alpha crystal structure), beta, and liquid in order to construct the phase diagram.


Regarding " The third term represents the energy difference between A-B interactions and the average of A-A and B-B interactions. [I am not sure this is completely necessary", this term is, in fact, vital. Entropy will always favour complete mixing. What inhibits mixing is the cost of having interfaces between A and B components. This balance leads to phase separation and a well-defined surface tension between the phases.
ReplyDeleteGautam,
DeleteThanks for the correction. I agree.